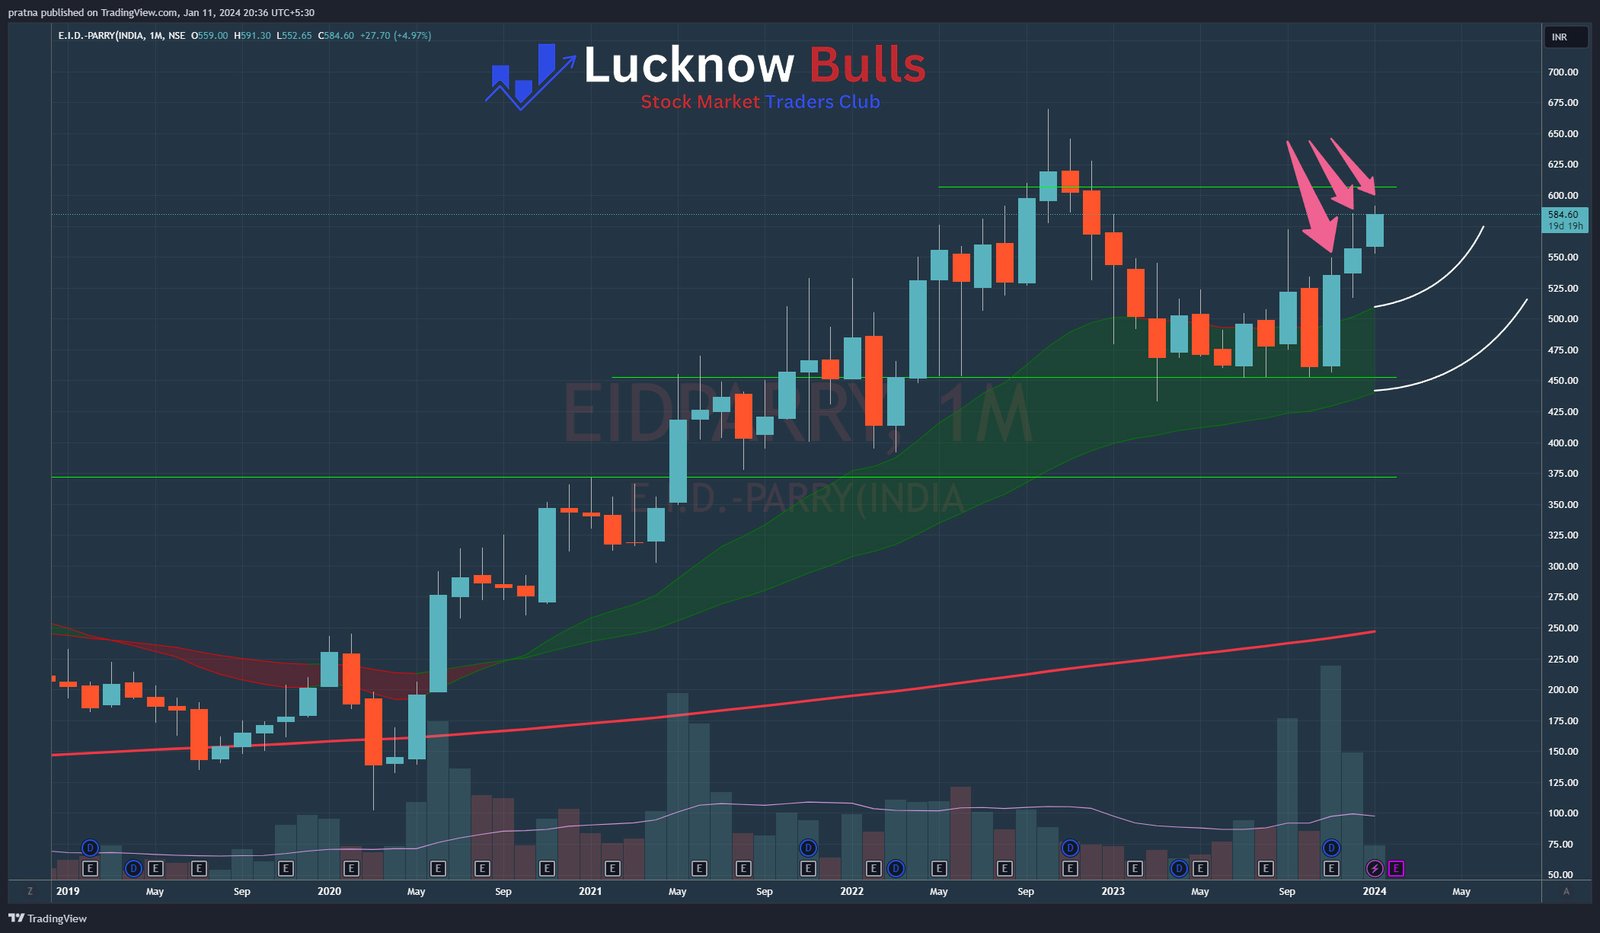
Jan 11, 2024: Today, we will analyze EID Parry’s setup and learn about the price action on the charts.
If we closely look at the chart of EID Parry for Nov’23, Dec’23, and Jan’24 till date, then we can see that the Dec’23 candle filled the upper wick of the Nov’23 candle, and the Jan’24 is doing the same with Dec’23 candle. If somehow we can draw a single candle for those three months, it will be one huge homogenous candle—the volume candles too back such a strong accumulation move.
Also, notice the hand-drawn continuation of GREEN BANDS in white; it shows the BAND will continue to take off further with curvature upwards only.

The CMP of EID Parry is 584 and I expect the move within 6 months to be around 850. One can look at entering at this price.
Note: This is not a recommendation but for educational purposes only


