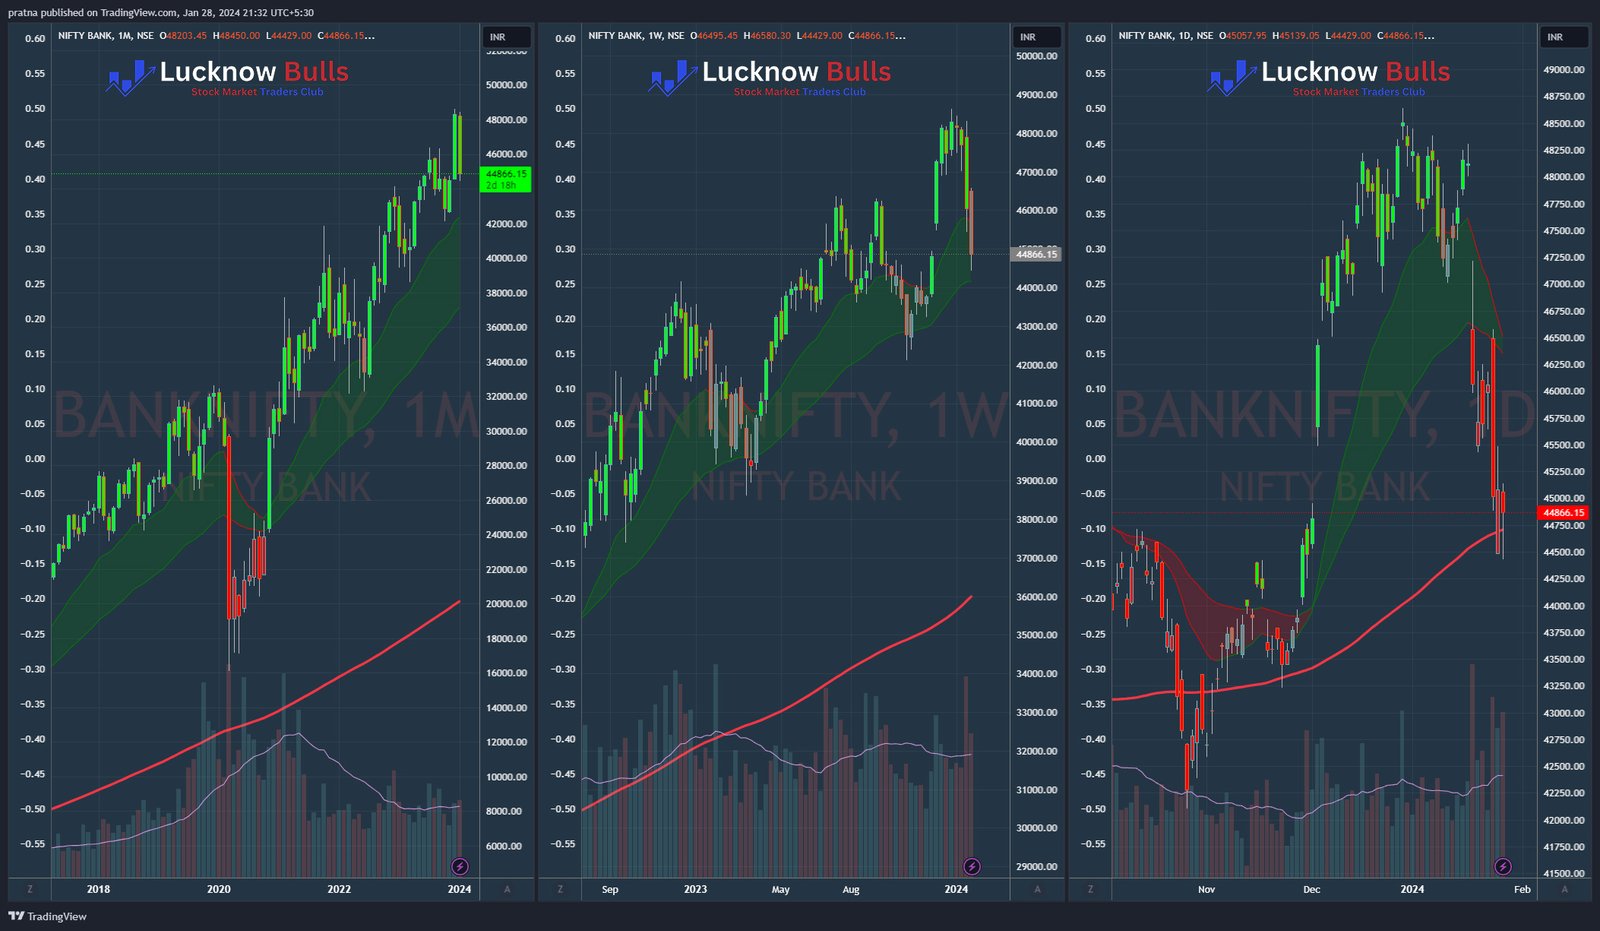
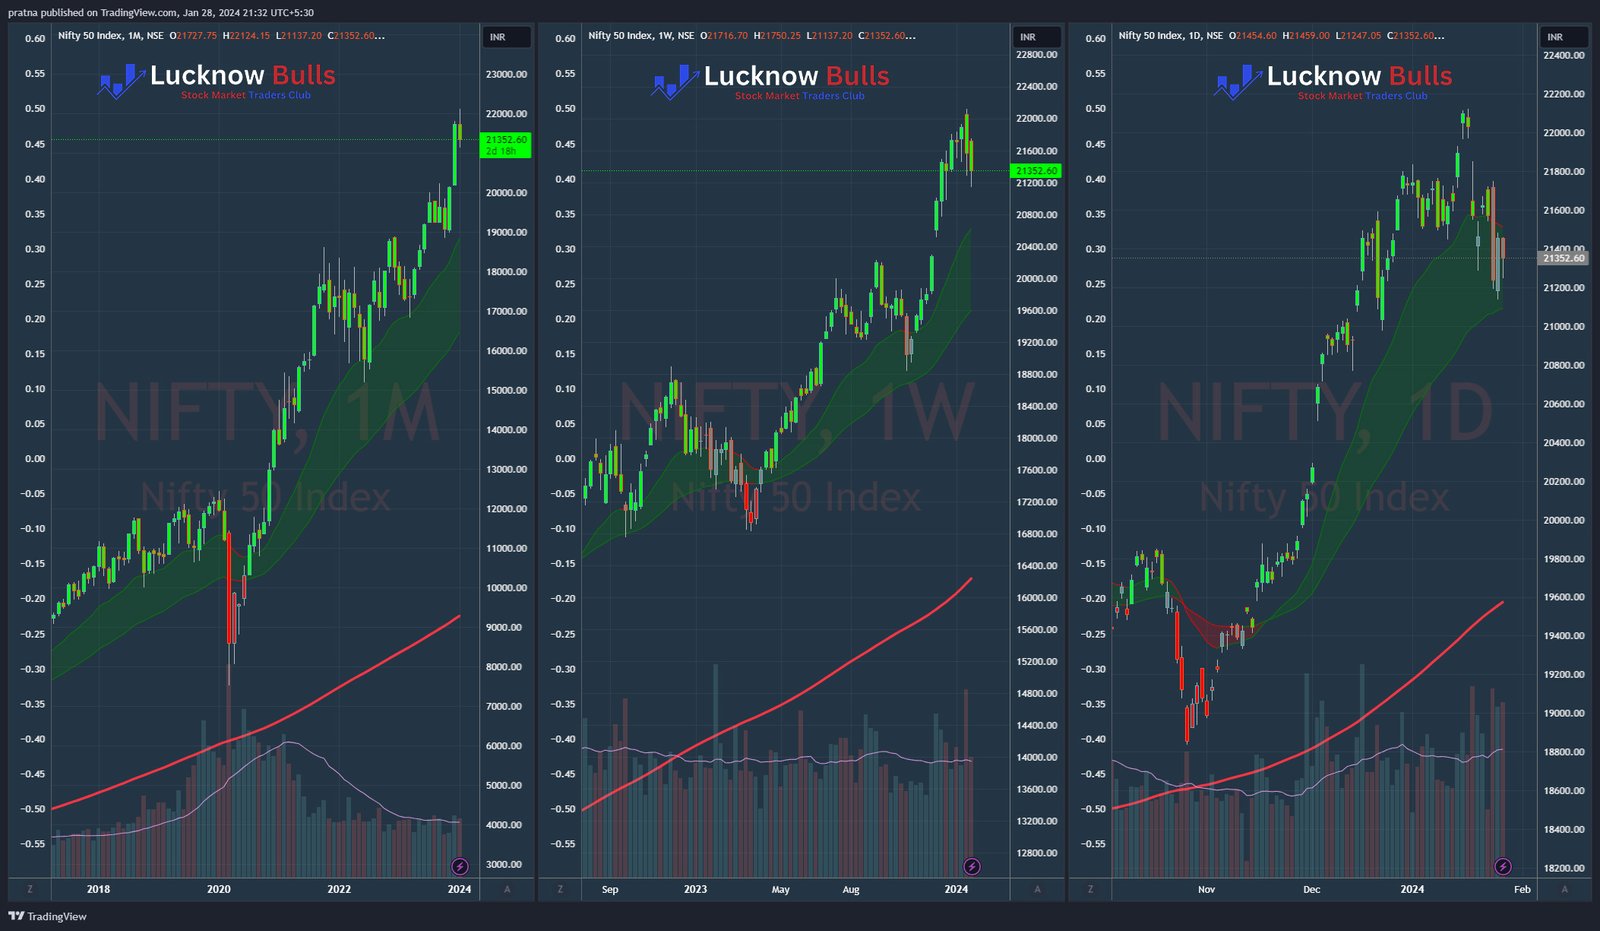
Jan 27, 2024: During last week, NIfty 50 and Bank Nifty corrected and made, back-to-back RED candles on weekly charts for two consecutive weeks. Out of the two, Nifty 50 seems to be stronger as it is still quite far away from its 20 EMA whereas, Bank Nifty is closer to its 50 EMA. On the Daily Chart, it seems that Bank NIfty has completed its short-term correction and should bounce and hence take the lead for providing immediate relief to the market before the budget session.
Bank Nifty:

On weekly, Bank Nifty is within the MA Ribbon whereas, on the Daily chart, it is taking support from 200 MA
Nifty 50:

Compared to Bank Nifty, Nifty50 on the Weekly chart is still quite far from the MA ribbon whereas on the Daily Ribbon, it’s touching the lower flank.
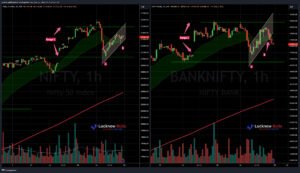
From the Price Action analysis, it seems markets should do a relief rally after 2 weeks of back-to-back correction. Price Action also provides important Support & resistance for both the Indices as below
| Levels | Support | Indices | Resistance | Levels |
| 44531 | S1 | Bank Nifty (current close: 44866) | R1 | 45139 |
| 44180 | S2 | -do- | R2 & R3 | 45507-45640 |
| 43289 | S3 | -do- | ||
| 42619 | S4 | -do- | R4 | 46580 |
| 21137 | S1 | Nifty 50 (Current Close: 21352) | ||
| 21090 | S2 | -do- | R1 | 21483 |
| 20979 | S3 | -do- | R2 | 21582 |
| 20618 | S4 | -do- | R3 | 21750 |
Besides the above, there are a few sectoral Indices that should continue to do well as their structure remains intact even after 2 consecutive weeks of correction in the broader markets
| Sectors looking good for W/o of Jan 28, 2024 | Current Close |
| Nifty Energy | 35203 |
| Nifty FMCG ( corrected a lot and should rebound) | 55214 |
| Nifty Infra | 7656 |
| Nifty IT | 36496 |
| Nifty Pharma | 17532 |
Pls do your due diligence, before you make any investment decisions based on this article.


